Use Goldratt’s Theory of Constraints, not job-costing
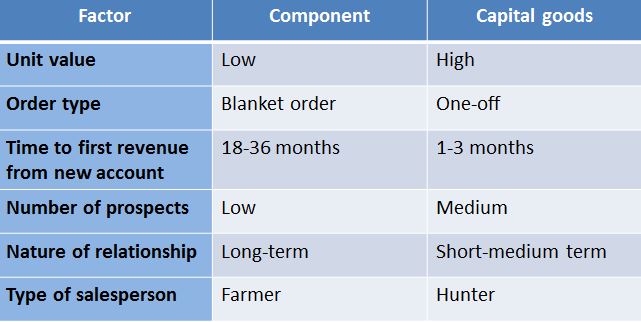
It’s almost 100 years since the essayist H.L. Mencken wrote: “There is always a well-known solution to every human problem—neat, plausible, and wrong”. Among the problems that printers face today is how to stay competitive with new capital investments, especially in digital equipment needed to enter new markets. I am going to suggest that the well-known spreadsheets frequently used to analyze the Return on Investment (ROI) of digital printing equipment are neat, plausible – and potentially misleading. (Elsewhere I have proposed a manufacturing simulator that shows an animated workflow, and allows some degree of statistical variation of orders and productivity to be built into an ROI analysis.) But in this article, I want to take a step back from detailed analysis and suggest a broad way of looking at productivity investments that is different from the standard approach.
The first problem to address is conventional job costing. Many printers rely on a software-based estimating system to generate quotes, and to provide the absorption-cost, Budgeted Hourly Rates (BHR) that go into an analysis of potential investments in new machinery. These estimating systems – while not necessarily wrong – can give a misleading view of how to price jobs and how to judge investments, because they allocate costs to jobs and press-hours. A cost accountant will argue that allocation of labor costs and overheads to cost-centers is a good thing, because it ensures that jobs can be priced to ensure that all the business’s costs are covered, and that it allows managers to be held accountable for metrics like departmental profitability, set-up times, and machine utilization.
Goldratt’s Theory of Constraints (TOC) teaches a different approach – one that takes a holistic view of the company’s ability to reach ‘The Goal’ – which is to increase ‘Throughput’. Goldratt holds that allocating costs within a business is potentially misleading and, like attempting to maximize the utilization of individual machines, results in sub-optimal decision-making. There are plenty of online resources describing TOC and its related ‘Throughput Accounting” methods so I will not describe them at length here, except to define the basic terms: Throughput (‘T’) is equal to Revenues (‘R’) minus Totally Variable Costs (‘TVC’) such as direct materials; Operating Expenses (‘OE’) captures the non-varying costs of creating Throughput – crucially, this includes direct labor since, in the short term, this does not vary with production volume; and Investment (‘I’), which includes inventories and other assets. The key equations of Throughput Accounting are:
Throughput (‘T’) = R-TVC
Net Profit (‘NP’) = T-OE, and
Return on Investment (‘ROI’) = NP/I
Using these definitions, let’s consider a simple situation of a business that uses a linear process to make products, graphing profit against production volume in a set time period. For a conventional printer, this could include cost-centers such as: pre-press, platemaking, printing, finishing and packing/shipping.
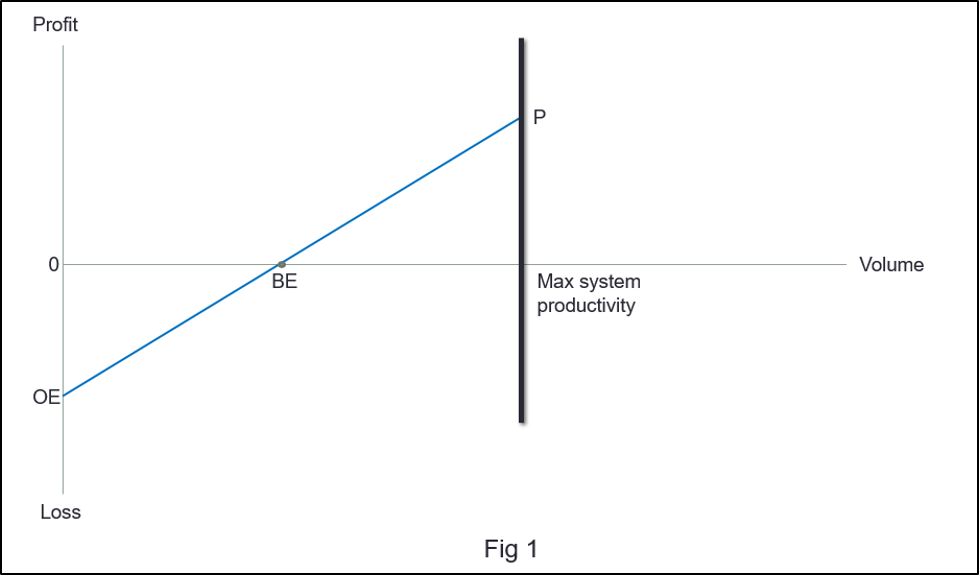
Here we can see that, with zero production, the business loses an amount equal to its Operating Expenses i.e. its fixed costs. As production volume grows, Throughput (R-TVC) increases until it passes the breakeven point (‘BE’) and continues upwards until the system cannot produce any more in the given time period and it hits a wall, producing the maximum profit of P.
How can we increase this profit?
• We can reduce our Operating Expenses, OE (moving the start of the line up the y-axis), or
• We can increase Throughput T by
o Increasing Revenues or
o Reducing TVC (e.g. direct materials or sales commissions) or
o Removing the constraint represented by the wall in Fig 1.
Let’s look at these in turn, starting with reducing OE:
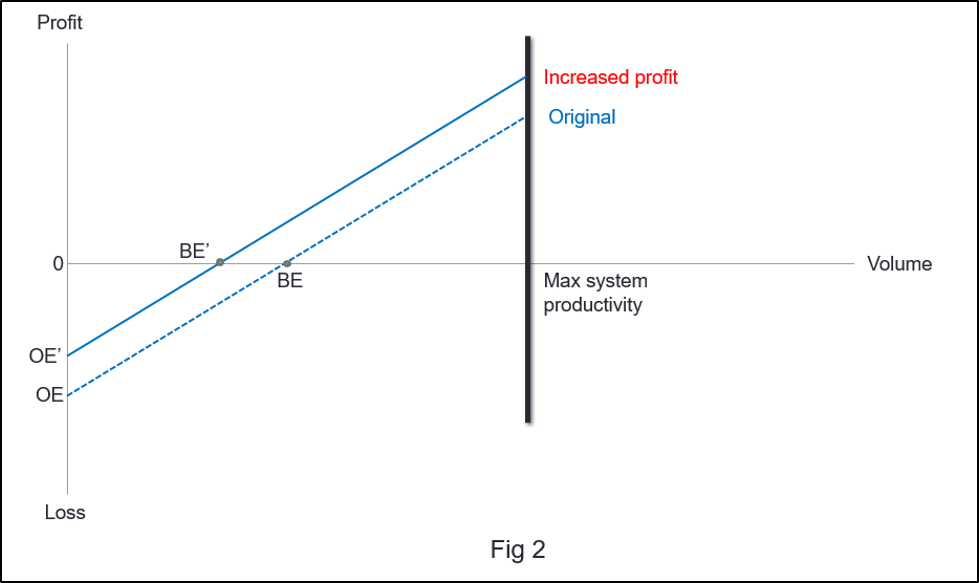
It’s pretty obvious that, by moving the line up to OE’ and keeping the slope of the line the same, we will reduce the volume at which the company breaks even and we will increase the profit that we can get when we reach ‘the wall’. What else can we do? We can note that the slope of the line is equal to throughput per unit volume or, in conventional terms, the contribution margin on the product (excluding direct labor).
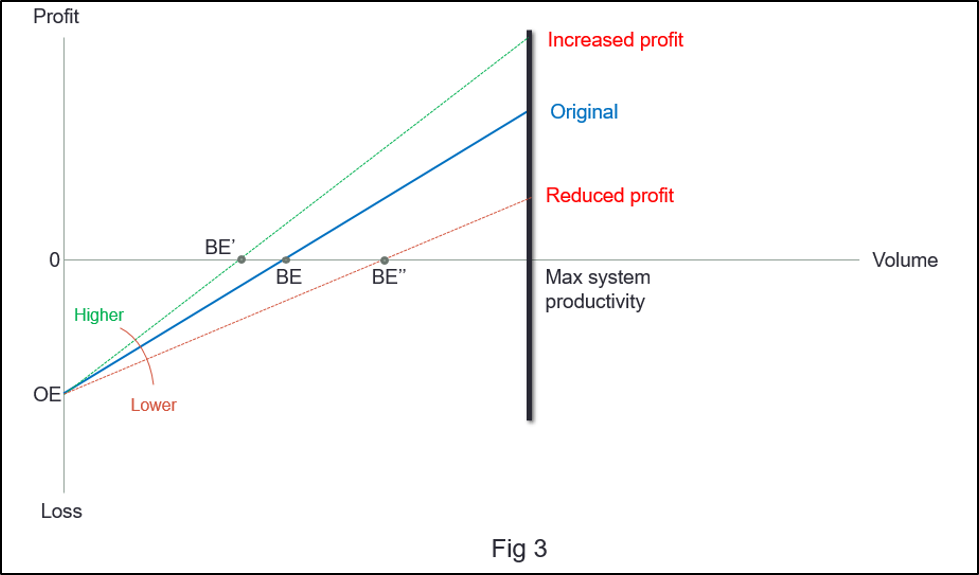
Increasing the revenue per job, or reducing its totally variable costs, has the effect of pivoting the line up more steeply – lowering the break-even point and increasing the maximum profit. Doing the opposite swings the line downward, making it harder to break even and reducing the maximum profit achievable. These effects are shown in Figure 3.
The analysis so far might strike you as what a colleague of mine used to call “a blinding flash of the bleeding obvious”. But bear with me as we consider an investment: the sales rep from your favorite digital printer vendor has just proposed an upgrade to your old machine that will allow it to run 50% faster than your current unit. The (totally variable) ink and paper costs per unit, and your direct labor costs (which, remember, we are considering to be part of OE) won’t change; in fact, your lease payments and maintenance contract will be higher than they are now, so OE will increase. But the printer itself will be faster – as fast (as the rep was not slow to tell you…) as the unit he has just sold to your competitor down the road. Let’s graph the effect:

Several points are immediately obvious: the line has moved downward, starting now at OE’, because of the increase in fixed costs. So the break-even point (BE’) has moved out to the right, which increases your business risk. Because the revenue and variable cost per unit haven’t changed, the slope of the line remains the same. The only good news is that the higher productivity of the new printer has moved ‘the wall’ to the right, allowing you – potentially – to make more profit.
But here’s the key point – this is only true if your old printer was the constraint (or bottleneck) in the system. The ‘system’ is defined as everything that converts raw materials into cash. If the true constraint is your prepress or finishing department, or your inefficient order processing, or the market itself, all your new investment will do is to make it less likely that you can be profitable. You will have spent money without increasing Throughput because ‘the wall’ is not where you thought it was. This is why the TOC ‘five focusing steps’ start with identifying the system constraint and then exploiting it to the fullest extent.
Let us take a less gloomy view of the potential investment, and assume it is indeed going to address a production constraint. Furthermore, perhaps it will allow you to retire some old analog equipment, or reduce the space needed for production or inventory, or save labor or overtime – possibly resulting in a net reduction in OE. More significantly, it might allow you to enter a new market, or address the needs of a less price-sensitive group of customers. How does this change the picture?
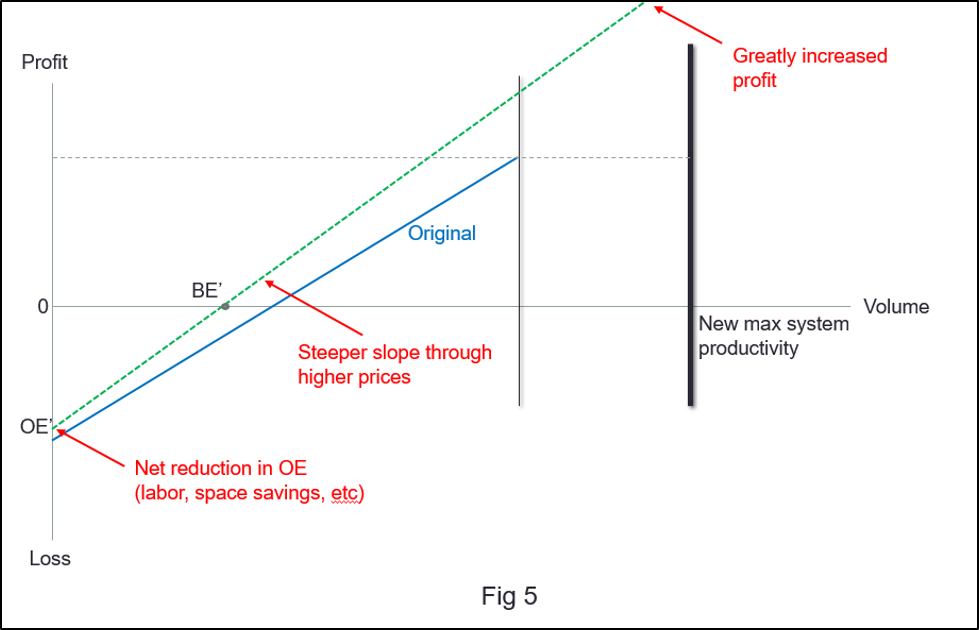
The investment is unlikely to reduce direct materials costs (unless you have a problem with waste that it will address), but the new market might allow you to charge higher prices. This means more Throughput, so the productivity line gets steeper – good! As Figure 5 illustrates, the combination of a small reduction in OE, a steeper slope to the Throughput line, and a higher maximum achievable volume has resulted in a lower break-even point and much greater profit potential. On this basis, the new investment looks easily justifiable.
The real world, unfortunately, is more complicated than this idealized picture. Printers are not producing identical widgets at constant prices; they are taking jobs at different prices, with different run-lengths, and printing them on machines of differing set-up times and run-speeds. But this does not mean that TOC thinking has no value. It leads to the realization that, as long as you have production capacity available, taking any work for which Throughput is positive (R>TVC) is valuable – even though, on an allocated cost basis, it may look unprofitable. (In his books, Goldratt calls this “making a mafia offer” – one that the customer cannot refuse, because the price or delivery terms are so attractive. He points out that this tactic needs to be used with care to ensure that it does not set a new low price point in a core market.)
The key point is that any positive Throughput contributes to fixed costs. For example, you may find that, given a short-run job opportunity but with a digital printer that is already fully-loaded, making plates and setting up an offset press might make sense – even though the estimating software that uses your ‘standard cost’ model is telling you the job is unprofitable on that machine.
Too many printers rely on a ‘cost-plus’ model using BHR to determine pricing. Throughput Accounting leads away from a ‘cost-plus’ model of pricing in favor of doing the hard work of finding out the true value to the customer of your service, and pricing accordingly. (Industry financial analysts New Direction Partners cite an even more pernicious result of using ‘cost-plus’ pricing: inadvertently giving away the benefits of your investment in new technology by basing prices on the newly-lowered costs that result from the investment!)
Many years ago, new to the pre-press and printing industry, I asked the owner of a small printing company what management metrics he used to keep track of his business. “Well I reckon that, if the overtime is up and the overdraft is down, I’m doing OK”, he said.
If your metrics for managing your printing business are the levels of your company’s overdraft and shop overtime, you are ‘driving by the rear-view mirror’ and probably not in control of your business. And if you rely on conventional cost accounting systems to tell you whether to take new work or enter new markets, maintaining competitiveness and profitability will be a struggle in today’s dynamic business climate. We need more sophisticated measures of the business, better methods for pricing by market segment, and better ways of evaluating potential investments. Relying on conventional cost accounting methods can be misleading – TOC and Throughput Accounting provide a different and valuable perspective.
This article first appeared in Printing Impressions.